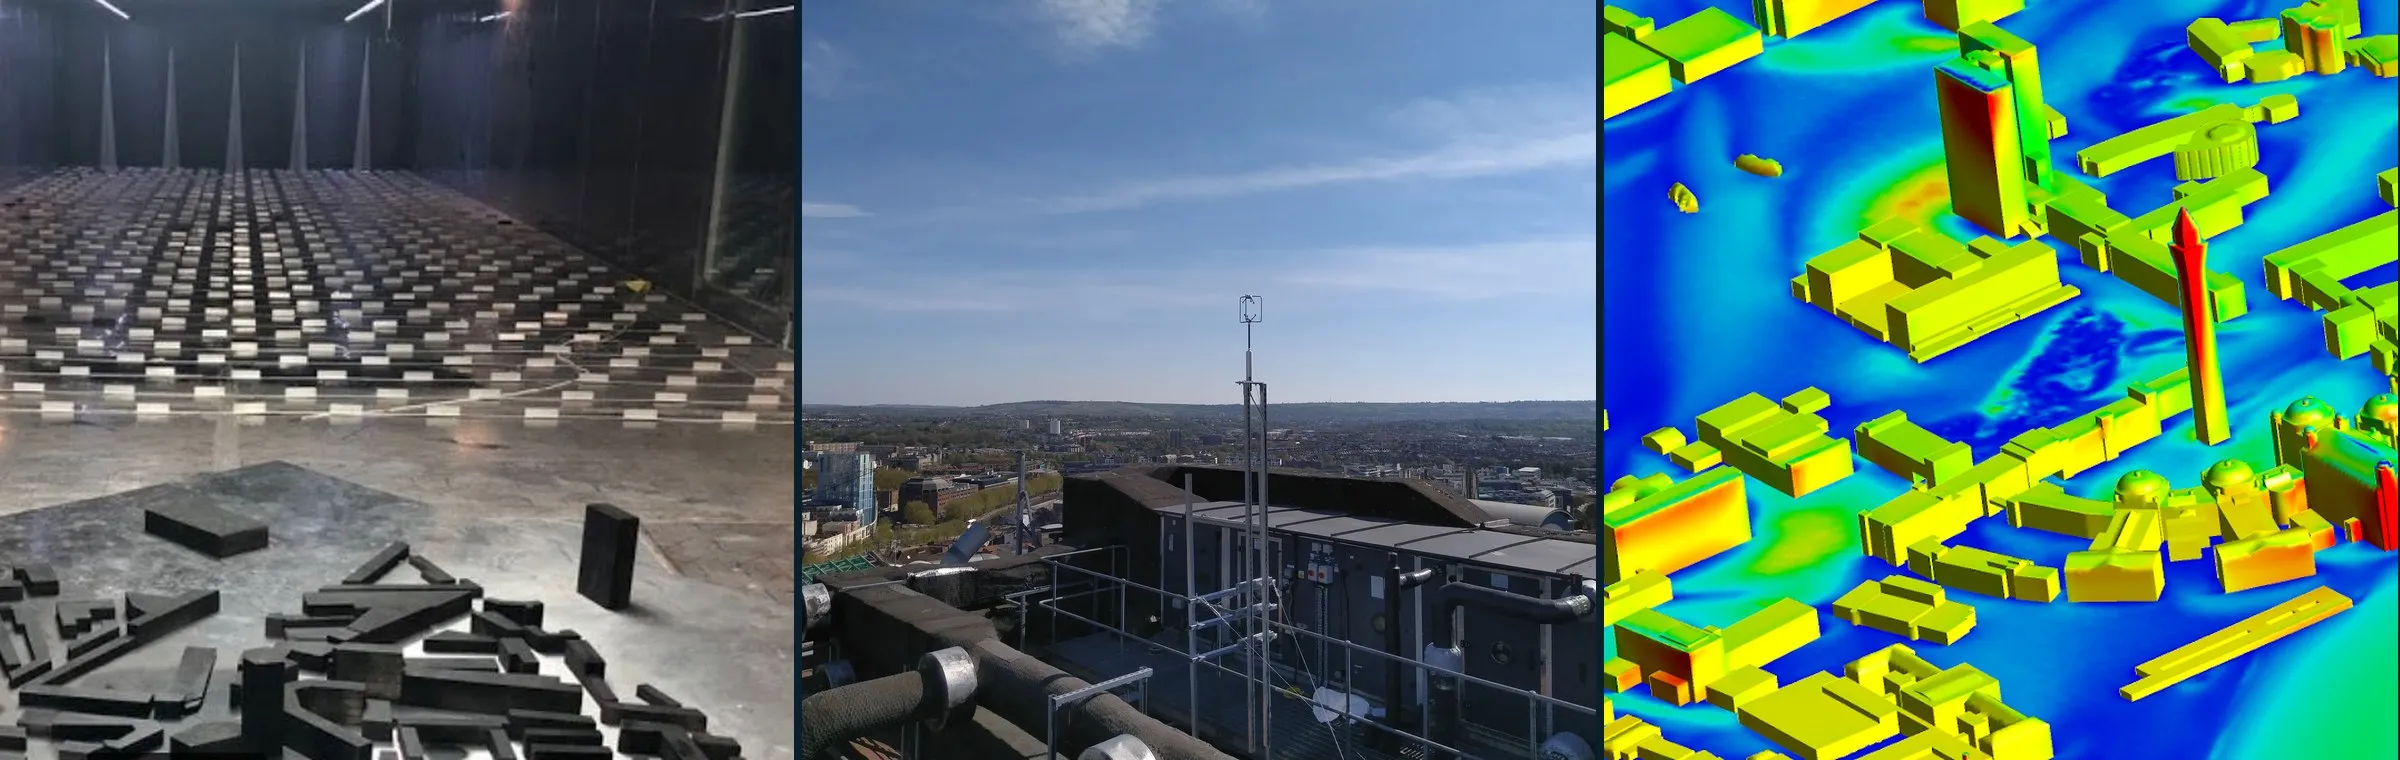
Urban fluid mechanics data & tools
Measurements, simulation output, codes, geometries and benchmark cases for urban flow, gathered from the community and from open repositories (Zenodo, CEDA). Largest and most reusable resources first.
Filters
-
Large-eddy simulations of turbulent airflow over 314 realistic urban neighbourhoods from 62 cities in 20 countries, with plan-area densities from 0.05 to 0.75 and several wind directions. Provides canopy-averaged statistics and flow fields, which are useful for canopy parameterisation, model validation and machine learning of urban wind.
Simulation Simulation outputGeometry LES
- UrbanTALES: idealised building blocks 224 cases
224 large-eddy simulations of flow over idealised building-block arrays. They systematically vary plan-area density (8 values, 0.0625 to 0.64), aligned and staggered layouts, 7 building-height distributions, and perpendicular or oblique wind. A parameter sweep for canopy parameterisation and model validation.
Simulation Simulation outputGeometry LES
-
High-resolution morphology, land cover and modelled UTCI thermal comfort data for seven European case study areas of CARMINE. Useful as urban geometry input and thermal comfort reference.
Collection · 9 parts Simulation GeometrySimulation output LES
-
The Architectural Institute of Japan (AIJ) urban wind environment benchmark suite: wind-tunnel and field data for cases A–M, from a single high-rise building and cube arrays to real districts such as Shinjuku and Niigata, many with STL geometry. Widely used to validate CFD for pedestrian-level wind and dispersion.
Collection · 12 parts Benchmark Lab MeasurementsCase setup Wind tunnel
-
Boundary-layer wind tunnel surface pressure measurements on parametric low-rise prismatic buildings. Useful for wind load studies and model validation.
Collection · 4 parts Lab Measurements Wind tunnel
-
Precursor LES turbulent inflow boundary conditions for AIJ actual-urban benchmark case.
Benchmark Simulation Simulation outputCase setup LES
-
Input data for PALM-4U large-eddy simulations of coupled atmospheric and subsurface energy fluxes in Berlin. Useful as a case setup.
Collection · 3 parts Simulation Case setupSimulation output LES
-
WindEEE wind-field and aerodynamic pressure data for a CAARC high-rise building in atmospheric boundary layer and downburst-like flows. Useful for wind-load validation.
Collection · 3 parts Lab Measurements Wind tunnel
-
Harmonised data from a street-level network of 42 automatic weather stations in Freiburg for 2022. Useful for intra-urban temperature and wind variability.
Collection · 27 parts Field Measurements
-
Non-stationary pressure and velocity measurements on a low-rise duo-pitch building model in the WindEEE Dome under ABL, downburst and combined winds. Useful for wind-load studies of non-synoptic winds.
Collection · 2 parts Lab Measurements Wind tunnel
- urbisphere Doppler wind lidar: Paris 11 parts
Raw Doppler wind lidar measurements at the Paris-region site Arboretum Vallee-aux-Loups from the urbisphere campaign. Useful for urban boundary-layer wind and turbulence profiles.
Collection · 11 parts Field Measurements
-
UT-GLOBUS global building height dataset for urban studies and modelling.
Tools & geometry Geometry
-
High-resolution synthetic 3D concentration fields of an air pollutant in urban environments. Useful for ML training and dispersion model comparison.
Simulation Simulation output ML / surrogate
-
Wind-tunnel tests of a selected area of Benidorm.
Collection · 2 parts Lab MeasurementsGeometry Wind tunnel
-
URANS cross-comparison on the AIJ Niigata case against wind-tunnel data.
Benchmark Simulation Simulation outputCase setup RANS
-
WRF-Chem concentration output for four land-use scenarios over the Barcelona metropolitan area during a heatwave. Useful for mesoscale urban air-quality and climate studies.
Simulation Simulation output Mesoscale model
-
Core dataset for testing regional climate models and urban schemes over Paris.
Simulation Case setupSimulation output Mesoscale model
-
Present and future daily air temperature and heat-stress indicator maps from UrbClim for 54 African cities.
Simulation Simulation output Mesoscale model
-
Turbulent inflow data of a rough atmospheric boundary layer for LES of Michelstadt, the semi-idealised Central European city model from the University of Hamburg wind-tunnel test cases (CEDVAL-LES), not the real town.
Simulation Simulation outputCase setup LES
-
Benchmark package for source inversion of urban pollution dispersion using building geometry and sparse sensors, including PPMLES/MUST summaries. Useful for testing inversion and sensing methods.
Benchmark Simulation Case setupSimulation output LESML / surrogate
-
Raw Doppler wind lidar measurements at Berlin Rothenburgstrasse from the urbisphere campaign. Useful for urban boundary-layer wind and turbulence profiles.
Collection · 16 parts Field Measurements
-
Supplementary files for LES of firebrand transport and deposition over 12 idealised cubical arrays.
Simulation Simulation outputSoftware & tools LES
-
Full-scale surface pressure and velocity measurements on the 6 m Silsoe cube in natural wind, with wind-tunnel comparisons. Used as the CWE2000 validation case for CFD; time series and compiled means and variances are available.
Benchmark Field MeasurementsCase setup Wind tunnel
-
European tiles of the GlobalBuildingAtlas, with building footprints and heights split into 0.1 degree tiles by country. Useful as geometry input for urban flow and microclimate modelling.
Tools & geometry Geometry
-
World Urban Morphological Parameters Open Dataset in COG and WRF-WPS formats.
Tools & geometry Geometry
-
City-scale 3D building and tree datasets for Glasgow from airborne LiDAR, in OBJ, shapefile and CityJSON formats. Useful as urban simulation geometry.
Collection · 2 parts Tools & geometry Geometry
-
Modified source code, simulation directories and postprocessing for multi-layer SURFEX-TEB coupling with Meso-NH for urban climate of high-rise cities. Useful for mesoscale urban modelling.
Simulation Software & toolsSimulation output Mesoscale model
-
PALM model inputs and source code for high-fidelity urban air quality sensitivity simulations. Useful for dispersion LES setups.
Simulation Case setupSoftware & tools LES
-
Global LCZ map at 100 m from earth observation. Usable as input for urban climate models and morphology classification.
Tools & geometry Geometry
-
LES output of an urban canopy and dense vegetated canopies over varying terrain complexity, for roughness-sublayer momentum statistics and TKE budgets.
Simulation Simulation output LES
-
Data for diffusion-based sensor placement and reconstruction of turbulent flows in urban environments from DNS. Useful for ML reconstruction.
Simulation Simulation output DNSML / surrogate
-
Ensemble of LES of the MUST experiment for dispersion uncertainty.
Simulation Simulation output LES
-
Simulated plume concentration data in urban areas used to train the CityTransformer neural network. Useful for ML surrogates of urban dispersion.
Simulation Simulation output ML / surrogateLES
-
Simulation results for the Legerova street domain with air-quality observations. Useful for urban air quality and turbulence studies.
Collection · 2 parts Simulation Simulation output LES
-
Archive of London micrometeorological measurements covering wind, temperature, humidity, radiation and concentration. Useful for urban boundary-layer and urban climate studies; see the project site for the full list.
Collection · 13 parts Field Measurements
-
High-resolution height map of trees and buildings for Chicago, usable as CFD/LES geometry.
Tools & geometry Geometry
-
CFD data on wildfire-related PM2.5 dispersion in an urban area and the effect of vegetation density. Useful for urban pollutant dispersion studies.
Tools & geometry Simulation output
-
1:400 wind-tunnel model with uniform and non-uniform roof heights at 90° and 45° wind: LDA velocities and fast-FID concentrations quantifying pollutant exchange through canyon tops and lateral openings, packaged as a CFD validation case.
Benchmark Lab Measurements Wind tunnel
-
5–20 tonne pressurised liquefied chlorine releases in 2015–16, partly inside a staggered array of about 80 shipping containers, with concentration arcs out to 11 km: the key dense-gas benchmark for built environments.
Benchmark Field Measurements
-
Time-resolved wind-tunnel velocity data built to validate LES: three approach boundary layers, flow and puff dispersion in a cube array, and the 1:225 idealised Central-European city Michelstadt with flat or slanted roofs.
Benchmark Lab Measurements Wind tunnel
-
Full ENVI-met outputs and configuration for Via Milano, Pescara, with current and 2050 scenarios before and after redesign. Useful for urban thermal comfort case studies.
Simulation Simulation outputCase setup RANS
-
A real-city SF6 field release sampled at 20 detectors, plus wind-tunnel pedestrian-level concentration time series for continuous and puff releases in a model of the same downtown.
Benchmark Field Measurements Wind tunnel
-
Flow and concentration data in the 1:225 Michelstadt model for seven ground-level release scenarios, two wind directions, continuous and puff releases; the blind-test benchmark for emergency-response dispersion models.
Benchmark Lab Measurements Wind tunnel
-
U-Surf global urban surface property dataset for high-resolution urban climate modelling.
Tools & geometry Geometry
-
Hamburg wind-tunnel replica of the Mock Urban Setting Test container array, with flow statistics and dispersion; the main validation case of the COST 732 CFD best-practice guideline.
Benchmark Lab Measurements Wind tunnel
-
Urban Dispersion Program field studies in 2005: two intensive periods around Madison Square Garden (March) and six in Midtown (August) with up to seven perfluorocarbon and SF6 tracers, street-level and rooftop samplers, sonic anemometers and sodars, plus indoor and subway sampling in MID05.
Benchmark Field Measurements
-
Météo-France/CNRM campaign from February 2004 to February 2005: a city-centre flux tower and surface stations, boundary-layer profilers and intensive periods on the urban heat island, the urban boundary layer and aerosols. Widely used to evaluate urban canopy schemes such as TEB.
Benchmark Field Measurements
-
Wind tunnel pressure maps for non-standard shapes and structures. Useful for wind load studies.
Lab Measurements Wind tunnel
-
Source files, data and metadata of ExaQUte simulations of turbulent flow around rectangular bodies and the CAARC high-rise building with stochastic inlets. Useful as wind-engineering CFD case setups and output.
Simulation Simulation outputCase setup LESRANS
-
DTRA/DHS field study in July 2003: ten 8-hour intensive periods of SF6 releases in the central business district, sampled by 194 bag samplers and 25 fast-response analysers, with winds and turbulence measured at about 100 sites. A classic real-city dispersion benchmark.
Benchmark Field Measurements
-
Basel Urban Boundary Layer Experiment, 2001–02: a year-long network of energy-balance towers across urban, suburban and rural sites, with a June–July 2002 intensive period adding a wind profiler, sodar/RASS, lidar, a street-canyon tower and four SF6 tracer releases. A reference for urban roughness-sublayer turbulence and energy balance.
Benchmark Field Measurements
-
ENVI-met 5.6.1 simulation results for green infrastructure and nature-based solutions in the LIFE AGREEN_NET project (2019 and 2030). Useful for urban thermal comfort studies.
Simulation Simulation output RANS
- Wind-tunnel flow and dispersion around single buildings, street canyons and building arrays (CEDVAL)
The classic Hamburg validation database of wind-tunnel flow and concentration data with fully documented boundary conditions, for isolated obstacles, street canyons and obstacle arrays.
Benchmark Lab Measurements Wind tunnel
-
Classic multiscale urban dispersion campaign: SF6 and perfluorocarbon tracer releases with meteorology around a single building, across the downtown grid and over the wider city, mostly in stable night-time conditions. Files are openly downloadable by IOP.
Benchmark Field Measurements
-
Hamburg wind-tunnel model of the Joint Urban 2003 area of Oklahoma City, used in COST 732; the openly obtainable counterpart to the Joint Urban 2003 field data, whose archive is offline.
Benchmark Lab Measurements Wind tunnel
-
CityChem extension to the EPISODE model for urban atmospheric chemistry and dispersion at city scale.
Simulation Software & tools Mesoscale model
-
Distributed temperature sensing potential-temperature profiles along a 31 m mast in Helsinki, with turbulence temperature statistics. Useful for coastal urban surface-layer studies.
Field Measurements
-
Raw 16-second data from about 110 citizen-science low-cost weather stations in Leuven, 2019-2025. Useful for urban temperature and microclimate studies.
Field Measurements
-
PALM-LES input files for simulating how vehicle fleet electrification changes local aerosol concentrations in Helsinki. Useful as a ready urban LES case setup.
Simulation Case setup LES
-
Continuous Doppler wind lidar measurements of the coastal urban boundary layer and adjacent marine layer.
Field Measurements
-
Simulated hazardous gas dispersion data from GRAMM-GRAL over a chemical park building layout. Useful for dispersion and ML studies.
Simulation Simulation output RANS
-
3D ultrasonic anemometer data from the Beijing 325 m tower for urban boundary-layer turbulence.
Field Measurements
-
High-resolution wind tunnel pressure data for a high-rise building at Politecnico di Milano. Useful for wind load studies.
Lab Measurements Wind tunnel
-
Resulting data and source code for an inhomogeneous wind scheme for urban street canyons, validated against CFD. Useful for street-canyon pollutant dispersion parameterisation.
Collection · 5 parts Simulation Simulation outputSoftware & tools RANSAnalytical
-
Gridded ENVI-met outputs and visualisations for four European cities assessing urban heat mitigation measures. Useful for microclimate and thermal-comfort studies.
Simulation Simulation output RANS
-
Code modifications making the U-Surf dataset compatible with WRF.
Simulation Software & tools Mesoscale model
-
PALM-4U input and output data for the Granollers domain from the KNOWING project. Useful as an urban microclimate LES case.
Collection · 2 parts Simulation Simulation outputCase setup LES
-
Raw simulation data and MATLAB scripts for a multi-scale analysis of flow over heterogeneous urban environments. Useful for urban boundary-layer and roughness research.
Simulation Simulation outputSoftware & tools LES
-
Hourly 1 km WRF output over the Yangtze River Delta cities for a building-height change experiment, July 2020. Useful for urban morphology effects on weather.
Simulation Simulation output Mesoscale model
-
FluidUrban v1.0 geometry and mesh generator with model outputs and plotting scripts for urban ventilation and pollutant dispersion.
Simulation Software & toolsGeometrySimulation output RANS
-
Street-level automatic weather station network data for Bristol, UK. Raw 2024 part 2.
Collection · 6 parts Field Measurements
-
Numerical dispersion simulations over the Paris Opera district using the PMSS model.
Simulation Simulation output RANS
-
WRF geo_em, wrfinput and wrfout files for high-resolution heat extreme runs over Sydney, with urban morphology.
Simulation Simulation outputCase setup Mesoscale model
-
Large (10 GB) dataset accompanying a study of multi-scale flow for scale-aware urban-canopy models; description is missing. Likely simulation output.
Simulation Simulation output LES
-
Example CFD simulation and code for distributed training of a U-Net predicting urban aerodynamic flow and pollutant dispersion. Useful for ML surrogates of urban flow.
Simulation Simulation outputSoftware & tools ML / surrogateRANS
-
Time-resolved non-isothermal turbulent inflow boundary data from LES of a stratified boundary layer, for OpenFOAM. Useful as inlet condition for building flow LES.
Simulation Simulation outputCase setup LES
-
OpenFOAM-v8 set-ups for wind and concentration fields in several street-canyon scenarios.
Collection · 2 parts Field Case setupMeasurements RANS
-
Dataset accompanying the GMD article on a conservative immersed boundary method for multi-physics urban LES. Useful for model validation and cases.
Simulation Software & toolsSimulation output LES
-
Companion dataset for LES analysis of the role of trees in a street canyon.
Simulation Simulation output LES
-
1 m LiDAR digital surface and terrain models for main urban conurbations of England and Scotland. Usable as urban geometry including buildings.
Collection · 3 parts Tools & geometry Geometry
-
PALM LES output for an urban crossing and a Berlin square (Ernst-Reuter-Platz) with different radiative transfer parameterisations. Useful for urban microclimate model comparison.
Simulation Simulation output LES
-
Data accompanying the uDALES 1.0 GMD paper, an LES model for urban environments. Useful as validation and case setups.
Simulation Software & toolsSimulation outputCase setup LES
-
Input and output files for four WRF urban configurations over the Tel-Aviv coastal metropolitan area.
Simulation Simulation outputCase setup Mesoscale model
-
PALM model source, configuration and input data for implementing traffic-induced heat and velocity in street-scale LES (Legerova street case). Useful for urban LES of traffic effects.
Simulation Software & toolsCase setupSimulation output LES
-
Input and output spatial data of ENVI-met microclimate simulations for Florence studying tree design scenarios in an industrial area. Useful for urban heat mitigation modelling.
Collection · 2 parts Simulation Simulation outputCase setup RANS
-
Nine low-cost ventilation screening fields and climate-analysis layers for Linz, Austria, for two westerly inflow cases, accompanying an LES benchmark protocol. Useful for evaluating ventilation screening methods.
Simulation Simulation outputGeometry LES
-
Turbulence measurements from the MoTUS project in an urban setup.
Field Measurements
-
RANS simulations of thermal street canyon pollutant dispersion with surrogate models.
Collection · 2 parts Simulation Simulation outputSoftware & tools RANSML / surrogate
-
ANSYS Fluent case files and mesh (14.8M cells) for PM2.5 dispersion from vehicle emissions in an urban area. Useful as a reusable CFD case setup.
Simulation Case setupSimulation output RANS
-
One-minute radiation (direct, global, diffuse, longwave) and basic meteorological data from the Friedrichstadt rooftop station in Berlin during the urbisphere campaign. Useful for urban surface energy balance and model evaluation.
Collection · 4 parts Field Measurements
-
Global building height to side length ratio and roof albedo parameters for urban land surface models.
Tools & geometry Geometry
-
OBJ 3D model of 914 buildings in Celje with triangle-level material attributes, built for high-resolution urban simulations.
Tools & geometry Geometry
-
Continuous scanning Doppler-lidar wind measurements of downslope winds over the city and Port of Genoa, December 2024 to March 2025. Useful for urban boundary-layer and wind-hazard studies.
Field Measurements
-
Dataset of microscale atmospheric flow simulations around randomly generated urban geometries for several stability classes. Useful for training and testing ML surrogates of urban flow.
Simulation Simulation output RANSML / surrogate
-
SURFEX outputs and verification data on town characteristics and urban climate in Vantaa.
Simulation Simulation output Mesoscale model
-
Urban morphology parameters for British Columbia, Canada, for WRF.
Tools & geometry Geometry
-
Grid-cell morphology and microclimate indicators for 67 cities with STL building models for CFD.
Tools & geometry Geometry
-
Configuration, code changes and scripts for WRF/Noah/SLUCM urban climate simulation of the Hong Kong-Shenzhen area. Useful as a mesoscale case setup.
Simulation Case setupSoftware & tools Mesoscale model
-
PALM simulation results on the effects of street trees, green roofs and green walls on urban microclimate. Useful for urban greening studies.
Simulation Simulation output LES
-
Simulation results for the Holesovicky domain in Prague covering air quality and thermal comfort scenarios. Useful for urban microclimate scenario studies.
Simulation Simulation output LES
-
SanDyPALM is a toolbox for creating static and dynamic drivers for PALM urban microclimate simulations. Useful for setting up urban LES cases.
Simulation Software & toolsGeometry LES
-
Part I of wind-tunnel flow measurements in a 1:200 model of part of Southwark, London, examining tall buildings and height variability. Useful for validating urban flow models.
Collection · 2 parts Lab Measurements Wind tunnel
-
HEAT-ALARM urban morphology and environment database for highly resolved urban WRF simulations, including LCZ.
Simulation GeometryCase setup Mesoscale model
-
PIV and LDV wind tunnel measurements of flow past a vegetated street canyon from TWEET-IE twin test 1. Useful for validating vegetation in urban flow models.
Collection · 2 parts Lab Measurements Wind tunnel
-
Hourly UrbClim-HiREx simulation output for Ghent during the June 2023 heat wave: air temperature, humidity, wind speed at 100 m and meter-scale heat-stress indices. Useful for urban heat stress studies and model validation.
Simulation Simulation output Mesoscale model
-
Integrated geospatial database of land cover, building morphology and local climate zones for Vicosa, Brazil. Useful as urban geometry input for microclimate models.
Tools & geometry Geometry
-
CityGML LOD1 3D building model of Enugu, Nigeria with footprints extruded to DEM-based heights. Usable as city-scale building geometry.
Tools & geometry Geometry
-
Digital surface model of Basel combining terrain, building heights from the 3D city model and tree heights from lidar, for the diFUME project. Usable as urban geometry.
Tools & geometry Geometry
-
Training and testing data and code for UCNN, a deep-learning urban canopy model for complex building morphologies.
Simulation Software & toolsSimulation output ML / surrogate
-
Research software generating CityGML-compatible 3D city models from heterogeneous data, with web interface and demo outputs. Useful for building urban geometry for simulations.
Tools & geometry Software & toolsGeometry
-
SUEWS V2020b inputs, model runs and code for heat and CO2 fluxes in Beijing. Useful for urban surface energy balance modelling.
Simulation Simulation outputCase setupSoftware & tools Mesoscale model
-
Standardised protocol and QGIS plugin to automate ENVI-met microclimate model setup. Useful for generating urban microclimate cases.
Simulation Software & toolsCase setup RANS
-
TURDATA from the TURBAN Prague campaign: low-cost air quality sensor network, meteorological station and remote-sensing vertical profiles in the Legerova street domain. Intended for validating micro-scale urban dispersion models.
Field Measurements
-
palmgeo converts open national or municipal geodata into verified static drivers for PALM. Useful for generating urban LES geometry inputs.
Simulation Software & toolsGeometry LES
-
LCZ-wizard builds customised urban environments for microscale simulations from local climate zones. Useful for generating idealised urban geometry.
Tools & geometry Software & toolsGeometry
-
PALMPaint is a pixel-painting tool to create and edit PALM static drivers with buildings, trees and streets. Useful for setting up urban LES geometries.
Simulation Software & toolsGeometry LES
-
CFD code, case settings and results for natural ventilation among units of double-loaded apartment floors with four plan shapes. Useful as ventilation case setups.
Simulation Case setupSimulation output RANS
-
CAD geometry and simulation-ready models for four windcatcher shaft designs for natural ventilation CFD. Useful as case setups for building ventilation studies.
Simulation GeometryCase setup RANS
- Building-resolved LES wind fields for Beijing, Shanghai, Guangzhou, Shenzhen and Hong Kong (U3DWind)
720 time-mean lattice-Boltzmann LES cases at 10 m resolution, 144 per city, spanning 16 wind directions, 3 reference speeds and 3 seasonal profiles, with 3D mean velocity and TKE plus building, terrain and footprint geometry. Very large (about 25 TB).
Simulation Simulation outputGeometry LES
-
Notebooks, WRF-SLUCM configuration files and processed outputs assessing local warming from data-center heat emissions in California. Useful as a mesoscale urban simulation case setup.
Simulation Simulation outputCase setupSoftware & tools Mesoscale model
-
High-density urban air temperature (and meteorological) network across the Birmingham conurbation, for urban heat island studies.
Collection · 3 parts Field Measurements
-
Input data for PALM with SALSA aerosol module evaluation, including building heights, leaf area density and aerosol emissions. Useful for urban aerosol LES setups.
Simulation Case setupGeometry LES
-
100 m Local Climate Zone maps and morphology parameters for five Greek cities for numerical modelling.
Tools & geometry Geometry
-
About 31 million vector building footprints with height, structure, function, age and other attributes: footprint-level geometry for LES and CFD domains anywhere in mainland China.
Tools & geometry Geometry
-
Global 100 m gridded building height and morphology for 13189 urban areas in 2020, usable for urban climate modelling and geometry.
Tools & geometry Geometry
-
LOD1 building and podium blocks for all of Hong Kong (plus textured landmarks), roads, bridges and a terrain model, updated every two months: realistic geometry for the dense high-rise city.
Tools & geometry Geometry
-
Energy spectra, kinetic energy time series and PALM input files for an urban flow modelling study.
Simulation Simulation outputCase setup LES
-
ENVI-met parameterisations, inputs and postprocessing scripts for assessing grass grid pavers' heat mitigation. Useful for reproducing urban microclimate scenarios.
Simulation Case setupSoftware & tools RANS
-
Surface-atmosphere energy exchange data from eddy-covariance and scintillometer measurements in Enschede. Useful for urban flux model evaluation.
Collection · 2 parts Field MeasurementsSimulation output LES
-
Open database of over 300 million individual buildings across the EU, UK, Norway and Switzerland, with height, type and age, for city-scale geometry and morphology parameters.
Tools & geometry Geometry
-
Japan's national open CityGML city models: LOD1 buildings with heights everywhere and LOD2 in many core districts (e.g. central Tokyo), in CityGML, 3D Tiles, OBJ and other formats; ready-made realistic geometry for CFD of Japanese cities.
Tools & geometry Geometry
-
Python code that rasterises OpenStreetMap building footprints into the geometry input required by PALM. Useful for setting up realistic urban LES domains.
Tools & geometry Software & toolsGeometry
-
CFD model set-up reproducing results on tree impact on gas concentrations in a street canyon.
Simulation Case setupSimulation output RANS
-
Python tool that extracts and rasterises building footprints from OpenStreetMap to produce urban geometry for LES. Useful for preparing realistic city-neighbourhood LES cases.
Tools & geometry Software & toolsGeometry
-
About 10 million buildings for the whole of the Netherlands at several levels of detail, in CityJSON, GeoPackage and OBJ: realistic geometry for Dutch urban CFD.
Tools & geometry Geometry
-
Input geometries and wind pressure coefficient results from CpSimulator, a cloud-based platform for predicting Cp on buildings. Useful for natural ventilation and wind-load studies.
Simulation GeometrySimulation outputSoftware & tools RANS
-
Data for evaluating high-resolution urban climate simulations with urban canopy parameters. Useful for mesoscale urban model set-up and evaluation.
Simulation Simulation outputGeometry Mesoscale model
-
Tool creating randomised urban landscapes with fractal-like street networks from building density, green fraction and frontal area. Useful for generating CFD/LES geometries.
Tools & geometry Software & toolsGeometry
-
Raw urban canopy parameter measurements from fieldwork in Kampala (2018). Can be turned into detailed input fields for urban climate models.
Field GeometryMeasurements
-
Source and test cases of urbanChemFoam, a weakly compressible reactive OpenFOAM solver for urban street canyons.
Simulation Software & toolsCase setup LES
-
National 10 m raster of building height for 2020, estimated from radar, optical and night-light imagery (RMSE about 6 m); a source of urban morphology for parameterisations and mesoscale models across China.
Tools & geometry Geometry
-
Building footprints with estimated heights worldwide for 2020, as regional shapefile tiles; strongest in China, weaker in Japan and Korea.
Tools & geometry Geometry
-
Calibration measurements, PALM simulations and survey data for urban thermal hotspots in a Czech city. Useful for evaluating urban microclimate LES and thermal comfort.
Field Simulation outputMeasurements LES
-
JRC Global Human Settlement Layer estimate of average building height on a 100 m grid worldwide for 2018; a consistent source of urban morphology for parameterisations and mesoscale models.
Tools & geometry Geometry
-
Naphthalene sublimation measurements in a wind tunnel street canyon model from Reading, giving scalar transfer in urban canyons.
Collection · 3 parts Field Measurements Wind tunnel
-
Scanning Doppler lidar and sonic anemometer data used to observe tall-building wakes in London.
Field Measurements
-
Raw microwave radiometer profile measurements of temperature and humidity at TU Berlin Charlottenburg campus, 2021-2022. Useful for urban boundary-layer thermodynamic structure.
Collection · 2 parts Field Measurements
-
Processed outputs and Python scripts from PALM, WRF and Fluent simulations for an urban model comparison.
Simulation Simulation outputSoftware & tools LESRANSMesoscale model
-
1 km gridded output from WRF v3.6.1 runs (apparently Birmingham BBUBL), for urban mesoscale meteorology.
Collection · 2 parts Simulation Simulation output Mesoscale model
-
Data and scripts to develop the dyOHM storage heat flux parameterisation and apply it in SUEWS at neighbourhood scale. Useful for urban surface energy balance modelling.
Tools & geometry Software & toolsSimulation output Analytical
-
Model code and data for COSMO-BEP-Tree, a coupled urban climate model with explicit street trees for regional simulations.
Simulation Software & toolsSimulation output Mesoscale model
-
Gap-filled flux tower observations with site characteristics for Urban-PLUMBER, for evaluating urban land surface models.
Field Measurements
-
Large-eddy simulation code for city-scale air dispersion in which buildings act as diffusive obstacles. Useful for urban dispersion modelling.
Simulation Software & tools LES
-
PALM results for heat exposure and mitigation in a densely populated neighbourhood during a hot day.
Simulation Simulation output LES
-
41 PALM NetCDF files of building-resolved wind fields for Camden, London, for scientific machine learning.
Simulation Simulation output LESML / surrogate
-
Aircraft profiles of wind, temperature, turbulence, sensible heat flux and trace gases in the urban boundary layer over the West Midlands (PUMA).
Collection · 2 parts Field Measurements
-
Offline one-dimensional multi-layer urban canopy model code based on BEP and BEM.
Tools & geometry Software & tools
-
PALM-CO2 extends the PALM LES model for urban CO2 transport with biogenic flux and anthropogenic emissions. Useful for urban LES carbon dispersion studies.
Simulation Software & tools LES
-
Dataset for evaluating high-resolution WRF/Noah/SLUCM urban climate simulations.
Simulation Simulation outputMeasurements Mesoscale model
-
OpenFOAM-based CFD code coupling full O3-NOx-VOC photochemistry for microscale reactive pollutant dispersion in urban areas.
Simulation Software & tools RANS
-
City-wide PALM microclimate raster outputs for Tallinn for a reference period and 2030-2050 development scenarios. Useful for city-scale heat studies.
Simulation Simulation output LES
-
Observations and CAIRDIO simulation results for an urban dispersion case study in Dresden. Useful for model evaluation.
Simulation Simulation outputMeasurements LES
-
EnviReader reads and visualises ENVI-met simulation outputs including 2D maps and 3D viewer with wind. Useful for postprocessing urban microclimate simulations.
Simulation Software & tools RANS
-
Time and space data from direct numerical simulations of turbulent flow over regular cuboid arrays (DIPLOS geometry). Useful for urban canopy turbulence studies.
Simulation Simulation output DNS
-
Hourly temperature, humidity, pressure, irradiance, wind speed and direction from 40 automatic stations on the NUS campus during 2025. Useful for urban microclimate and model evaluation.
Field Measurements
-
WRF simulations with several urban canopy model configurations used to study urban weather modelling. Useful for comparing urban parameterisations.
Simulation Simulation output Mesoscale model
-
Open-source Python package for fast urban wind-field prediction from geometry.
Simulation Software & tools ML / surrogate
-
Processed LES output and Python post-processing scripts for hurricane boundary-layer turbulence over complex urban canopies using an immersed boundary method.
Simulation Simulation outputSoftware & tools LES
-
Field and CFD data for physics-informed surrogate modelling of urban wind under sparse measurements.
Field MeasurementsSimulation output RANSML / surrogate
-
uDALES is open-source LES software for urban flow, dispersion and microclimate.
Simulation Software & tools LES
-
Turbulence observations from the 325 m Beijing tower and 102 m tower.
Field Measurements
-
Hourly 2024 observations from 48 automatic weather stations across Shenzhen, including wind speed and direction, temperature, humidity and pressure. Useful for urban climate and wind analysis.
Field Measurements
-
Hourly meteorological data from 17 weather stations in the Rome area. Useful for urban climate analysis and model evaluation.
Field Measurements
-
Single-column WRF output and observations from the King's College London tower used to study urban boundary-layer processes. Useful for evaluating urban boundary-layer schemes.
Field Simulation outputMeasurements Mesoscale model
-
Turbulence data from a 325-m tower in Beijing and a 102-m tower in Xianghe, used to compare scalar transport and coherent structures.
Field Measurements
-
Derived tables and scripts on wind turning with Paris wind and ERA5 boundary-layer height.
Field MeasurementsSoftware & tools
-
Half-hourly observed and modelled turbulent fluxes at a Munich tall tower, 2024-2025, supporting CO2 emission estimates.
Field Measurements
-
Notebooks and datasets for uncertainty quantification of WRF-SLUCM simulations related to urban morphology and heat stress.
Simulation Simulation outputSoftware & tools Mesoscale model
-
Surface meteorological data (wind, temperature) from Hangzhou 2013-2015 for studying interaction of mountain-plain wind with urban breeze.
Field Measurements
-
Derived tables, figure assets and scripts for analysis of urban boundary-layer vertical decoupling.
Field MeasurementsSoftware & tools
-
Reference implementation of the GSCC method for mapping relative urban ventilation capacity from building morphology at global scale. Useful for city-scale ventilation screening.
Tools & geometry Software & tools Analytical
-
Analysis and visualisation code for simulating vertical profiles of meteorological variables in urban neighbourhoods with UVDM-SLUCM.
Tools & geometry Software & tools
-
Code for diffusion-based sensor placement and reconstruction of turbulent flows in urban environments. Useful for flow reconstruction and sensor design.
Simulation Software & tools ML / surrogate
-
Mean wind pressure data for C-plan buildings with varying slot width and wing length. Useful for wind load studies.
Lab Measurements Wind tunnel
-
Monitoring campaign (Oct 2023-Jul 2024) of urban canyon climate including wind, temperature and humidity in vulnerable Madrid neighbourhoods. Useful for street-canyon field evaluation.
Field Measurements
-
Experimental and CFD pressure coefficients on facades and roofs for detailed and simplified building geometries.
Lab MeasurementsSimulation output Wind tunnelRANS
-
CFD dataset assessing pollutant removal by photocatalytic facades in open urban settings. Useful for urban air-quality mitigation studies.
Simulation Simulation output RANS
-
Data and code for building-resolving dispersion modelling coupled with street-scale CO2 observations. Useful for urban dispersion and emission-estimation studies.
Simulation Simulation output LES
-
Interactive D3Q19 lattice-Boltzmann wind analysis tool for 3D urban context.
Simulation Software & tools LES
-
Paper release of an agentic AI workflow that automates CFD wind simulations for buildings and cities. Useful for automated case setup.
Simulation Software & tools ML / surrogate
-
Deep learning model code predicting 3D wind speed fields in cities from building geometry.
Simulation Software & tools ML / surrogate
-
Python code for regression and machine-learning models predicting area-averaged external pressure coefficients on low-rise buildings. Useful for wind-load surrogates.
Simulation Software & tools ML / surrogate
-
Data for a validated comparison of lattice-Boltzmann and finite-volume LES for large urban flow simulations.
Simulation Simulation output LES
-
Observed and simulated near-ground wind data from two model configurations over heterogeneous urban surfaces. Useful for evaluating urban wind models.
Simulation Simulation outputMeasurements Mesoscale model
-
Data and scripts for a fast surrogate wind model over heterogeneous urban surfaces and terrain. Useful for rapid urban wind simulation.
Simulation Software & toolsSimulation output ML / surrogate
-
Data and scripts for a resistance-network model of near-surface winds, ventilation and pollutant transport in Yixing. Useful for urban ventilation studies.
Tools & geometry Simulation outputSoftware & tools Analytical
-
Experimental data on transient aerodynamics and wind loads on low-rise structures under non-synoptic winds from ERIES TRANSWindS. Useful for wind engineering.
Lab Measurements Wind tunnel
-
Harmonised automatic weather station and temperature logger observations from the UHIARC campaign in North-Eurasian Arctic cities.
Field Measurements
-
Cobra probe wind-tunnel measurements and LES of flow over downtown Montreal.
Lab MeasurementsSimulation output Wind tunnelLES
-
Wind tunnel measurements of thunderstorm-induced loads on tall buildings with synoptic and thunderstorm wind profiles. Useful for wind engineering studies.
Lab Measurements Wind tunnel
-
3D wind and concentration data at 5-minute resolution from El Prat del Llobregat for validating CFD.
Field Measurements
-
Concentration and velocity measurements in the Ecole Centrale de Lyon wind tunnel for urban geometries with street trees.
Lab Measurements Wind tunnel
-
Urban wind profile dataset from Doppler lidar in Tokyo.
Field Measurements
-
Vertical profiles of urban wind speed, direction and turbulence measured by lidar on the UCC campus.
Field Measurements
-
Observations from the 325 m Beijing tower on non-stationary turbulence over a megacity.
Field Measurements
-
Fortran code of a multilayer urban canopy model coupled with WRF.
Simulation Software & tools Mesoscale model
-
Wind tunnel measurements of rooftop wind environment of an isolated building for urban air mobility safety. Useful for validating rooftop flow models.
Lab Measurements Wind tunnel
-
Fortran code of the Real Urban Roughness scheme, an aerodynamic parameterisation for real urban morphology. Useful for urban canopy models.
Tools & geometry Software & tools Analytical
-
Wind tunnel and CFD data for pedestrian wind comfort around realistic university campus buildings. Useful for validating pedestrian wind CFD.
Lab MeasurementsSimulation output Wind tunnelRANS
-
WRF/BEP+BEM simulation outputs of rooftop heat-mitigation technologies across six tropical cities. Useful for urban thermal microclimate impacts.
Simulation Simulation output Mesoscale model
-
UrbanFlowNet-MFSS, a physics-regularised multi-fidelity surrogate for urban flow reconstruction.
Simulation Software & tools ML / surrogate
-
Data accompanying a study of embedded large-eddy simulation of the atmospheric boundary layer over an urban region using accelerated turbulence generation. Useful for LES inflow and urban boundary-layer modelling.
Simulation Simulation output LES
-
One of the world's longest urban flux records (tower running since 2004, successor to the BUBBLE experiment): half-hourly CO2, heat and momentum fluxes, friction velocity and stability with footprints for 2015–2025.
Field Measurements
-
Met Office UKV output for 109 days (2016-2018) used to evaluate urban sensible heat flux skill. Useful for urban NWP evaluation.
Simulation Simulation output Mesoscale model
-
Raw radiosonde (windsond) profiles during the urbisphere Paris campaign. Useful for urban boundary-layer structure.
Field Measurements
-
Harmonised data from a street-level automatic weather station network in Freiburg. Useful for urban microclimate and heat studies.
Field Measurements
-
Measured air temperature, humidity, radiation, globe temperature, wind speed and UTCI at static points and along walking routes in four Santiago neighbourhoods. Useful for outdoor thermal comfort studies.
Field Measurements
-
Long-running tall-tower eddy-covariance records of momentum, sensible and latent heat and CO2 over downtown and suburban Indianapolis, with raw 10 Hz data for turbulence statistics.
Field Measurements
-
Eddy-covariance flux and meteorological observations from Swindon, 2011-2013, with SUEWS forcing files. Useful for urban surface energy balance model evaluation.
Field Measurements
-
Year-long ARM Mobile Facility deployment with urban, rural and Chesapeake Bay nodes, measuring how the urban boundary layer differs from its surroundings through all seasons, including low-level jets and bay breezes. Doppler lidar, soundings, eddy covariance and profilers; free ARM account needed.
Field Measurements
-
Cut-cell extension with non-orthogonal surfaces for the PALM model system, allowing partially solid grid cells. Useful for LES of flow around complex urban geometry.
Simulation Software & tools LES
-
Source code of four modelling systems (CHIMERE, GRAMM, GRAL, VERT) for black carbon dispersion over Modena. Useful for urban air-quality and microscale dispersion modelling.
Simulation Software & tools Mesoscale modelRANS
-
Example binary output from the UltraHD CityCLIM large-eddy simulation model. Useful for model output formats and urban LES.
Simulation Simulation output LES
-
W2W translates WUDAPT Local Climate Zone maps into urban canopy parameters for WRF.
Simulation Software & tools Mesoscale model
-
Source code of PALM 24.04 used in a study of PALM-SLUrb.
Simulation Software & tools LES
-
LES velocity fields over urban canopies with inputs and U-net predicted fields, including perturbed cases. Useful for training and testing ML surrogates of urban flow.
Simulation Simulation output LESML / surrogate
-
Observations from a summer 2023 heat-stress campaign at Sterre campus, Ghent, with devices in varied micro-environments including green spaces. Useful for urban thermal comfort and microclimate model validation.
Field Measurements
-
Eddy covariance measurements at Berlin-Mitte from the urbisphere campaign. Useful for urban turbulence and surface flux studies.
Field Measurements
-
Raw radiosounding profiles of temperature, humidity and wind during the urbisphere Berlin campaign. Useful for urban boundary-layer structure.
Field Measurements
-
One-minute wind speed and direction at 16 m from a Gill sonic at Honor Oak Park, London.
Field Measurements
-
Quality-controlled half-hourly fluxes of momentum, sensible and latent heat and CO2 from city towers in Zurich and Paris, plus Doppler wind-lidar profiles, released by the EU ICOS Cities (PAUL) project.
Field Measurements
-
30-minute fluxes of momentum, heat, water vapour and CO2, plus raw 10 Hz sonic data, from a site among highways and buildings at UIC; part of the Chicago CROCUS network, which also runs Doppler lidar and SODAR (open but raw, not quality-controlled).
Field Measurements
-
10-minute air temperature and humidity from a 27-station urban network.
Field Measurements
-
WOCSS adapters for coupled WRF and OpenFOAM simulations using preCICE.
Simulation Software & tools RANSMesoscale model
-
Wind tunnel pressure coefficient database for three H-shaped and low-rise buildings. Useful for wind load and CFD validation.
Lab Measurements Wind tunnel
-
Hourly divergence profiles over Beijing urban areas derived from radar wind profiler measurements.
Field Measurements
-
Hourly air temperature from 12 urban sites in Novi Sad, Serbia, for 2016-2017. Useful for urban heat island analysis and model evaluation.
Field Measurements
-
Avian-borne meteorological sensor package data from flights over Birmingham in 2018-19, giving data above rooftops in the urban boundary layer.
Field Measurements
-
Continuous Doppler lidar in Baltimore from the BSEC Urban Integrated Field Lab: vertical-velocity variance, skewness and kurtosis, VAD wind profiles, boundary-layer and cloud-base height as daily CF-NetCDF files at 15-minute resolution.
Field Measurements
-
Regional climate simulations from WRF-CM-BEM coupled with an urban canopy and building energy model for the Tokyo area. Useful for mesoscale urban heat studies.
Simulation Simulation output Mesoscale model
-
BSEC network of street-level weather stations across Baltimore: temperature, humidity, wind, rain and solar radiation as 5-minute, hourly and daily CSV files from 2023.
Field Measurements
-
Metadata for the Schools Weather and Air Quality citizen-science network of weather stations across Sydney.
Field Measurements
-
Experimental data on a roof-mounted horizontal-axis wind turbine in an idealised urban boundary layer. Useful for rooftop flow validation.
Lab Measurements Wind tunnel
-
CFD vertical wind profile results, wind-profile scheme functions and validation against observations for inhomogeneous urban canopies. Useful for parameterising urban wind profiles.
Simulation Simulation output RANS
-
A year of ARM Mobile Facility observations around Houston, aimed at sea-breeze convection and aerosol–cloud interaction, with Doppler lidar, soundings, flux and tethered-balloon data on the coastal urban boundary layer. Free ARM account needed.
Field Measurements
-
Met Office UKV model output for two days used to evaluate urban sensible heat fluxes against scintillometry in London. Useful for urban NWP evaluation.
Simulation Simulation output Mesoscale model
-
Roadside measurements of NO released from a van, with wind speed and direction, used to validate CFD models in Oxford.
Field Measurements
-
Hourly temperature and humidity from 20 aspirated sensors within Madrid's urban canopy layer, 2014-2017 onwards.
Field Measurements
-
VCWG predicts urban microclimate relative to a nearby rural climate.
Tools & geometry Software & tools
-
Mixed layer height from a ceilometer at Marylebone Road, London, 2012.
Field Measurements
-
Code and data for including the urban canopy layer in a Lagrangian particle dispersion model.
Tools & geometry Software & tools
-
Python scripts reproducing analysis of distributed temperature sensing measurements of the coastal urban surface layer in Helsinki. Useful for urban boundary-layer turbulence analysis.
Field Software & tools
-
Fluxes of CO2, heat, momentum and particles from the SMEAR III urban tower in Helsinki, 2005–2021.
Field Measurements
-
Open-source successor to LANL's QUIC: a mass-conserving diagnostic wind solver on GPU (QES-Winds), a turbulence closure (QES-Turb) and Lagrangian dispersion (QES-Plume) for building-resolving runs much faster than real time.
Simulation Software & tools RANS
-
Observations from summer 2017 and winter 2018 campaigns on the effect of vegetation on air quality in urban street canyons.
Field Measurements
-
Large eddy simulation results over idealised urban topography. Useful for urban boundary-layer studies.
Simulation Simulation output LES
-
Eddy-covariance water, energy and carbon fluxes with ancillary meteorology at four urban landscapes in Phoenix during 2015.
Field Measurements
-
Multi-scale urban air pollution model coupling a chemistry-transport model with a street model, inert particles.
Tools & geometry Software & tools
-
Eulerian urban air quality model with embedded subgrid dispersion for high-resolution pollutant concentrations.
Simulation Software & tools Mesoscale model
-
WRF 3.6 outputs at 2 km over the Malay Peninsula for urban climate studies of Kuala Lumpur.
Simulation Simulation output Mesoscale model
-
17 street-level stations across the five boroughs plus rooftop eddy-covariance and Doppler-lidar / microwave-radiometer profiler sites. The flux readme warns of rooftop flow distortion.
Field Measurements
-
MLUCM v1.0 source code, a one-dimensional multi-layer urban canopy model.
Tools & geometry Software & tools
-
Python program to derive urban canopy parameters from 3D building and land-use datasets.
Tools & geometry Software & tools
-
Territory-wide modelled wind climate on a 500 m grid: annual, summer and winter directional wind frequencies and speeds at several heights, used to set inflow conditions for Hong Kong's statutory wind-tunnel and CFD air ventilation assessments.
Simulation Simulation output Mesoscale model
-
Wind field, cloud base and mixing-layer height time series from a Doppler lidar and ceilometer network in Stuttgart ([UC]2 programme). Useful for urban boundary-layer studies.
Field Measurements
-
Stereo PIV and surface pressure measurements around an idealised cubic building with and without vertical openings, under high- and low-shear boundary-layer inflow. Useful for validating near-building flow and ventilation simulations.
Lab Measurements Wind tunnel
-
High-resolution meteorological observations from a five-station network in Kampala, Uganda.
Field Measurements
-
Full-scale Silsoe campaign on a 6 m cube, isolated and within an array of straw cubes, with three opening set-ups each. Ventilation was measured with pressure and tracer methods alongside internal and external flow, temperature and pressure; useful for cross-ventilation studies.
Field Measurements
-
2D PIV wind-tunnel data of turbulent boundary layers over twelve urban roughnesses with different frontal and plan solidities. Useful for studying turbulence statistics and parameterising urban roughness.
Lab Measurements Wind tunnel
-
LES and DNS datasets of velocity and concentration around a tall building in an aligned array of rectangular buildings, from the DIPLOS project. Useful for studying scalar fluxes and validating dispersion models.
Simulation Simulation output LESDNS
-
10 Hz sonic data at 40, 80, 120, 160 and 200 m on an urban meteorological tower, July–August 2017, with fluctuations, spectra and statistics; suited to momentum and heat transport in the convective urban boundary layer.
Field Measurements
-
National Environment Agency stations across Singapore with minute-level air temperature, humidity, wind and rainfall from 2016, available through an API.
Field Measurements
-
Wind-tunnel measurements of flow and dispersion over an idealised urban street system, from the DIPLOS project. Useful for validating LES and DNS of urban dispersion.
Lab Measurements Wind tunnel
-
Meteorology and air quality field campaign in London in 2011-12, with multiple sites and intensive observations during the 2012 Olympics. Useful for urban boundary-layer and air quality studies; individual datasets are available via the paper authors.
Field Measurements
-
Field and physical-model measurements of wind-driven air infiltration into a building near the DAPPLE site in London. Useful for studying how the urban environment affects building ventilation.
Field Measurements Wind tunnel
-
Urban atmospheric observations in London, including meteorological measurements on the BT Tower and Doppler lidar boundary-layer wind profiles. Useful for urban wind profiles, roughness and boundary-layer studies.
Field Measurements
-
Air pollution field campaigns in London in 2006/7 with measurements at ground level and at 160 m on the BT Tower. Useful for studying pollutant concentrations and transport above and within a megacity.
Field Measurements
-
Doppler lidar observations of the urban boundary layer over London during REPARTEE-II, including wind and boundary-layer depth. Useful for studying urban boundary-layer dynamics.
Field Measurements
-
Tracer release experiments from the 2004 DAPPLE field campaign in central London. Useful for validating urban dispersion models against measured concentrations.
Field Measurements
-
Field measurements of flow and turbulence at the DAPPLE intersection in London, linked to a study of traffic-related pollutant concentrations near the junction. Useful for studying dispersion at urban intersections.
Field Measurements
-
Intensive tracer dispersion experiments with accompanying flow measurements at the DAPPLE site in central London (2007). Useful for testing urban dispersion and emergency-response models.
Field Measurements
-
Large-eddy simulation of street-scale flow and dispersion of multiple tracers in a realistic urban area, including wind-direction effects. Data available on request from the author.
Simulation Simulation output LES
-
Rooftop meteorological measurements from the BT Tower during the DAPPLE campaign in London, used to reference street-level flows. Useful as reference wind and turbulence data for urban dispersion and emergency-response studies.
Field Measurements
-
Large-eddy simulation data of flow, turbulence and dispersion over random urban-like obstacle arrays. Useful for urban canopy turbulence statistics and dispersion model validation.
Simulation Simulation output LES
-
Perfluorocarbon tracer (PMCH) concentration measurements at sites around Birmingham characterising dispersion of pollutants within and from the city.
Field Measurements
-
95 boundary-layer wind-tunnel datasets from the University of Western Ontario with pressure-tap time series on gable-roofed low-rise building models in several terrains, as self-documenting HDF files.
Lab Measurements Wind tunnel
-
Field measurements of wind in street canyons near an urban intersection in London using ultrasonic anemometers. Useful for validating street-scale flow models.
Field Measurements
-
Traffic and air pollution data from the DAPPLE site in central London. Useful for relating traffic emissions to pollutant concentrations at an urban intersection.
Field Measurements
-
Field measurements of wind at the Marylebone Road intersection in London (DAPPLE site), collected to study pollution hotspots. Useful for understanding flow and dispersion at a real urban intersection.
Field Measurements
-
Wind-tunnel measurements of near-wall flow over urban-like roughness, including form drag and roughness sublayer behaviour. Useful for rough-wall boundary-layer studies and surface parameterisation.
Lab Measurements Wind tunnel
-
Physical-model data on flow and concentration for idealised urban geometries, from a project on rapid sensor deployment after outdoor chemical releases. Useful for dispersion and sensor-placement studies.
Lab Measurements Wind tunnel
-
Project on human-centred building design combining field, CFD and physical-model studies of urban flow and ventilation. Data release is pending; contact the project for access.
Field MeasurementsSimulation output Wind tunnel
-
Project developing integrated models and decision-support tools for city design for natural ventilation and air quality, with CFD, field and physical-model work. Full data release is pending.
Field MeasurementsSimulation outputSoftware & tools Wind tunnel
Nothing matches these filters.
Know a dataset, code or benchmark we're missing? Email the portal contacts. The catalogue is refreshed monthly from Zenodo and CEDA; entries marked “Tags proposed by AI” have not yet been checked by hand.